In today’s data-driven business environment, filtering relevant data is crucial for making informed decisions. This is achieved through Key Performance Indicators (KPIs) and metrics. While all KPIs are metrics, not all metrics qualify as KPIs.
KPIs (Key Performance Indicators): KPIs measure performance based on specific business goals and objectives. They are strategic indicators that impact a company’s strategic decisions. For example:
- Sales Growth
- Number of Referrals
- Repeat Customers
Metrics: Metrics evaluate the performance of specific business processes and are more operational than strategic. They support overall success but do not directly influence strategic decisions. Examples include:
- Bug Fix Rates
- Automation Metrics
- Lead to Conversion Ratio
Example: Increasing Profit
- KPIs: Number of sales, number of licenses sold.
- Metrics: Website visitors, number of clicks, best-performing campaigns.
Case Studies
Logistics: Efficient logistics and warehouse management are vital for success. A key KPI here is order cycle time, which tracks the duration from order placement to shipment. Businesses aim to minimize this time, monitoring it frequently to address unexpected factors like sudden demand spikes. Supporting metrics include:
- Picking Accuracy
- Shipping Time
- Equipment Utilization
Sales Growth: Increasing sales by 20% involves various departments. Each tracks its own metrics to understand their contributions to the goal. Metrics like the lead-to-conversion ratio provide deeper insights for strategic decisions. If the conversion rate is low, strategies can be adjusted to motivate potential customers.
Best Practices
Separate Metrics from KPIs:
- Avoid measuring everything. Focus on what is most important for your business. Overloading with data can waste time and resources.
Choose the Right KPIs:
- Use techniques like SMARTER (Specific, Measurable, Attainable, Relevant, Time-bound, Evaluate, Reevaluate) and the Six A’s (Aligned, Attainable, Acute, Accurate, Actionable, Alive) to select valid KPIs.
Visualize KPIs and Metrics:
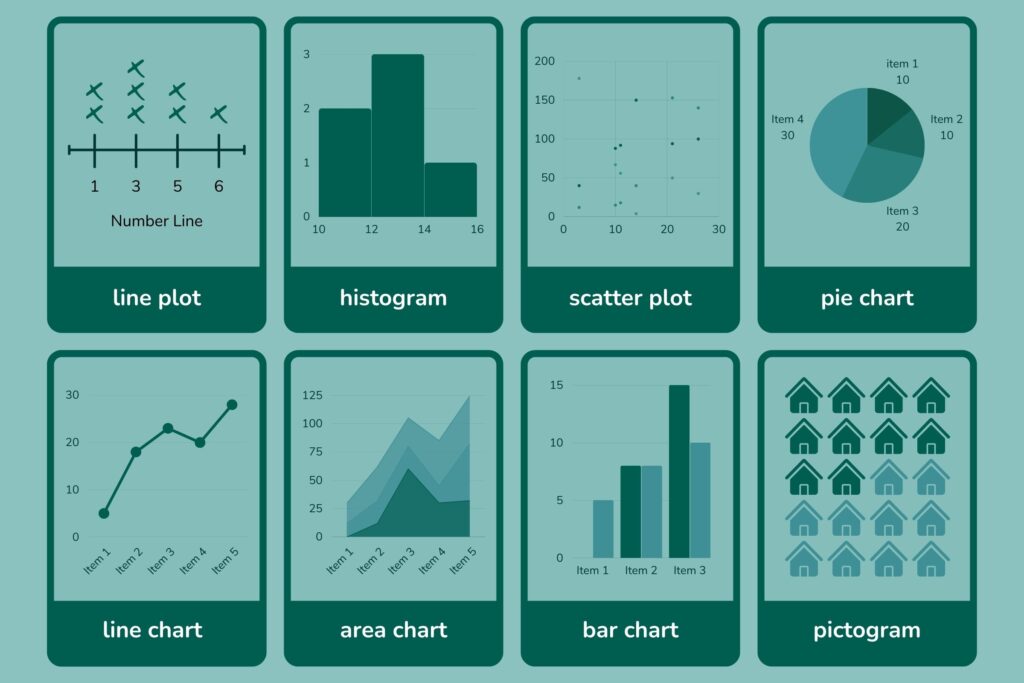
- Use interactive dashboards to transform data into actionable insights. Choose the right graphs and charts to effectively communicate your data story.
Avoid Vanity Metrics:
- Focus on metrics that inform future strategies. Avoid indicators that look good on paper but do not provide actionable insights, like social media follower counts that do not translate to sales.


